View multiple readings per sample in quality checks
You can view multiple readings for sample-based questions in a quality check. When multiple readings are taken, the system displays the highest, average, and lowest values along with all other readings on a line chart. This is only available for sample-based questions and is helpful for tracking measurement.
Follow the steps below to view multiple readings per sample in quality checks.
- Open the required quality check on the Quality Control App page.
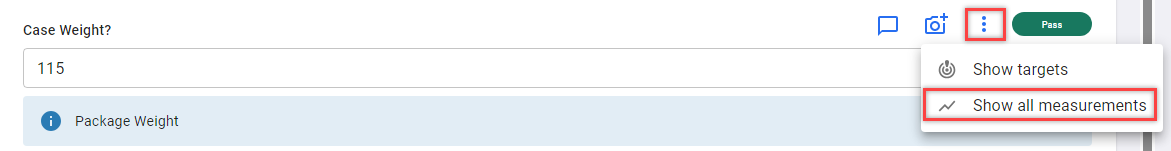
Enter the values as specified for questions requiring multiple readings per sample. Based on the quality plan, each sample will allow multiple readings. - Select the Ellipsis menu for a specific question.
-
Select the Show all measurements action.
The All Measurements dialog opens, displaying a line chart of all readings per sample and showing each reading point on the graph.
The line chart displays the following calculated values:
- Highest Value
- Average Value
- Lowest Value
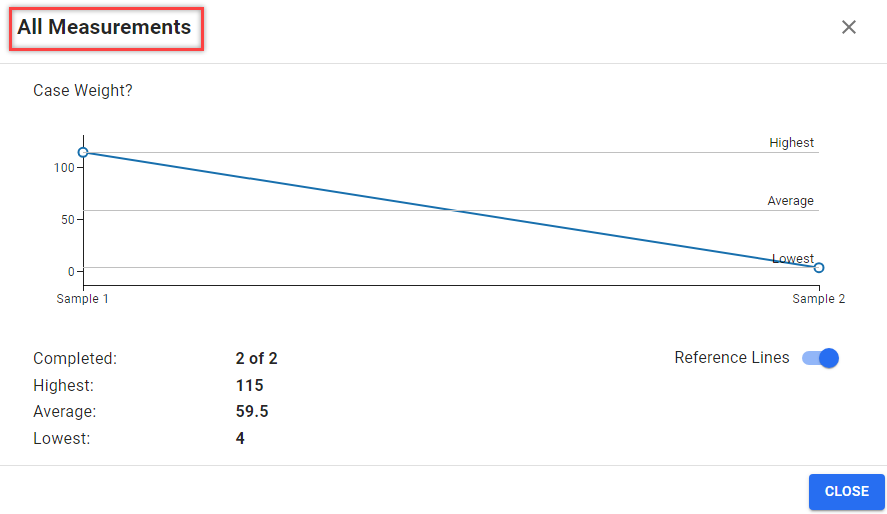
You can turn off the Reference Lines toggle if you prefer not to see the reference lines on the graph.
All readings from each sample will appear along the line, showing trends or variations across samples.
- If any reading is missing, the system displays a blank value at that point, and the graph will show a gap in the line for that reading.
- If the question type is not an integer or decimal (for example, text or option), the Show all Measurements action will be disabled, as the system only supports numeric data for calculations.